Currently TXing
| Mode | Callsign | Target | Source | Dur (s) |
|---|
Last Heard List
| Time () | Mode | Callsign | Target | Source | Dur (s) | Loss | BER | QSO |
|---|
Local Heard List
| Time () | Mode | Callsign | Target | Source | Dur (s) | BER |
|---|
All Heard List
| Time () | Mode | Callsign | Target | Source | Dur (s) | Loss | BER |
|---|
Currently in QSO
| Callsign | Added at () | Last TX at () |
|---|
Dapnet-Messages
Messages in Queue: 0
System Info
CPU:
- Temperature: °C
- Frequency: MHz
- Usage: %
- Last Minute:
- Last 5 Minutes:
- Last 15 Minutes:
- Total: MB
- Used: MB
- Free: MB
- Usage: %
- Total: GB
- Used: GB
- Free: GB
- Usage: %
- Version: No Info Available
- Built: No Info Available
- Modem: No Info Available
- Callsign: No Info Available
- DMR-ID: No Info Available
- TX Frequency: No Info Available
- RX Frequency: No Info Available
Services Monitor

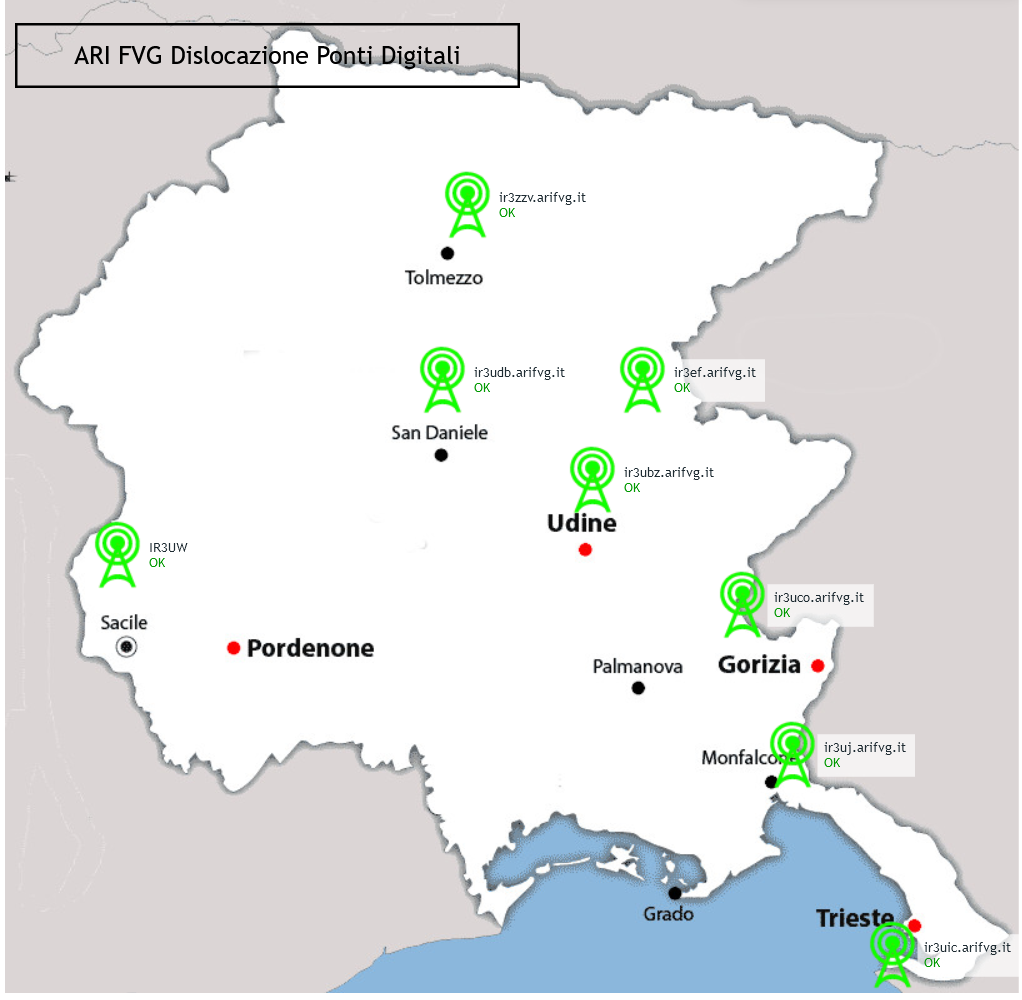
RETE RIPETITORI ARI FVG |
| Nominativo IR3UCO IR3UBZ IR3UIB IR3UIC IR3UJ IR3EF IR3ZZV IR3UDB IR3UFF IR3UP |
Frequenza 431.2250 MHz 431.4250 MHz 433.1250 MHz 430.2750 MHz 430.0750 MHz 145.5875 MHz 145.6125 MHz 431.2625 MHz 431.4125 MHz 431.0250 MHz |
Shift + 1,6 MHz + 1,6 MHz - 1,6 MHz + 1,6 MHz + 1,6 MHz - 600 KHz - 600 KHz + 1,6 MHz + 1,6 MHz + 1,6 MHz |
Posizione M.te Sabotino (GO) Udine città M.te Zoncolan (Ravascletto) (UD) Muggia Chiampore (TS) Monfalcone citta (GO) M.te Bernadia (UD) Cazzaso-Tolmezzo (UD) MHz San Daniele del Friuli (UD) M.te Lussari Tolmezzo (UD) Forcella Giais (PN) |